Holdings Overview

Overview
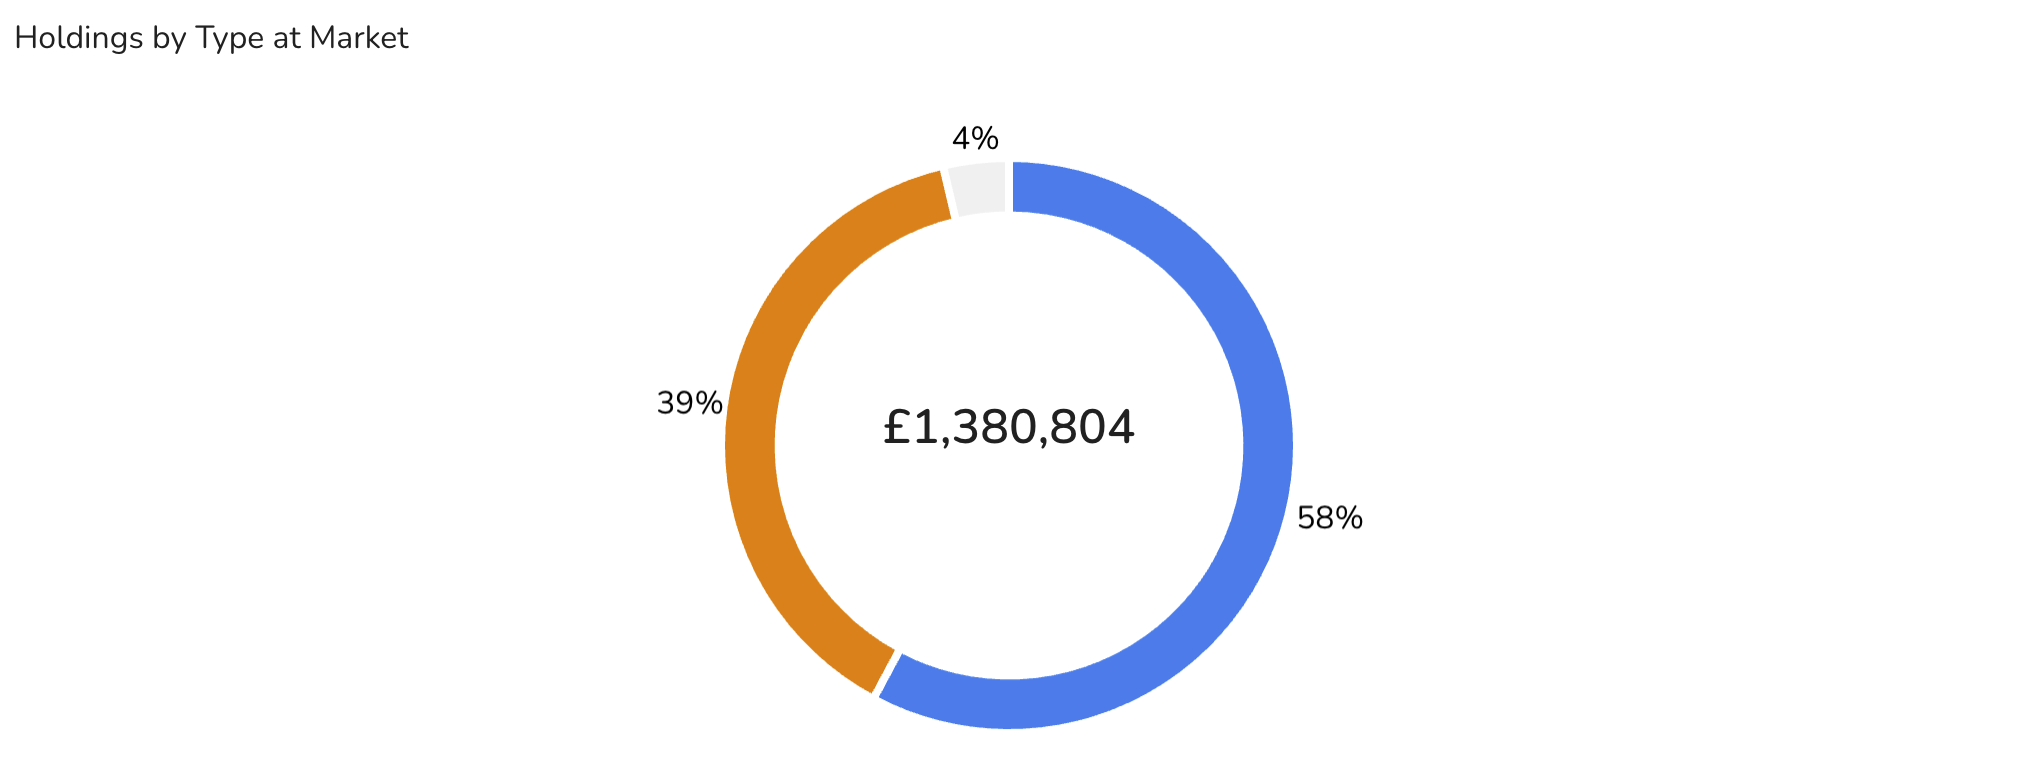
The Holdings Overview Chart Widget provides a visual representation of the allocation of your investments. Depending on the chosen settings, it can display either a bar chart or a pie chart, showing the percentage or value of holdings by Type (Fund, Stock, ETF), by Broker, or by Portfolio. Additionally, the widget can display both the chart and the accompanying data table or just the chart.
Data Displayed
- Holdings Allocation:
- Type: The distribution of holdings by type such as Fund, Stock, or ETF.
- Broker: The allocation of holdings across different brokers.
- Portfolio: The distribution of holdings within different portfolios.
Settings
-
Accessing Settings:
- Click on the settings icon to open the settings menu.
-
General Settings:
- Allocation by: Choose the criteria for displaying the allocation of holdings.
- Options include: Holding Type, Portfolio, Broker.
- Value at: Select the basis for the value calculation.
- Options include: Market, Cost.
- Data display: Determine how the data should be displayed.
- Options include: Both (Chart and Table), Chart, Table.
- Label: Choose the format for data labels.
- Options include: Percent, Value, None.
- Show Total Value: Toggle the display of the total value on or off.
- Allocation by: Choose the criteria for displaying the allocation of holdings.
-
Chart Settings:
- Chart type: Select the type of chart to display.
- Options include: Pie, Bar.
- Chart type: Select the type of chart to display.
-
Saving Changes:
- After entering all the necessary information, click "Save" to apply your changes.
- Buttons:
- Default: Resets the settings to default values.
- Cancel: Discards any changes made.
- Save: Applies and saves the changes.